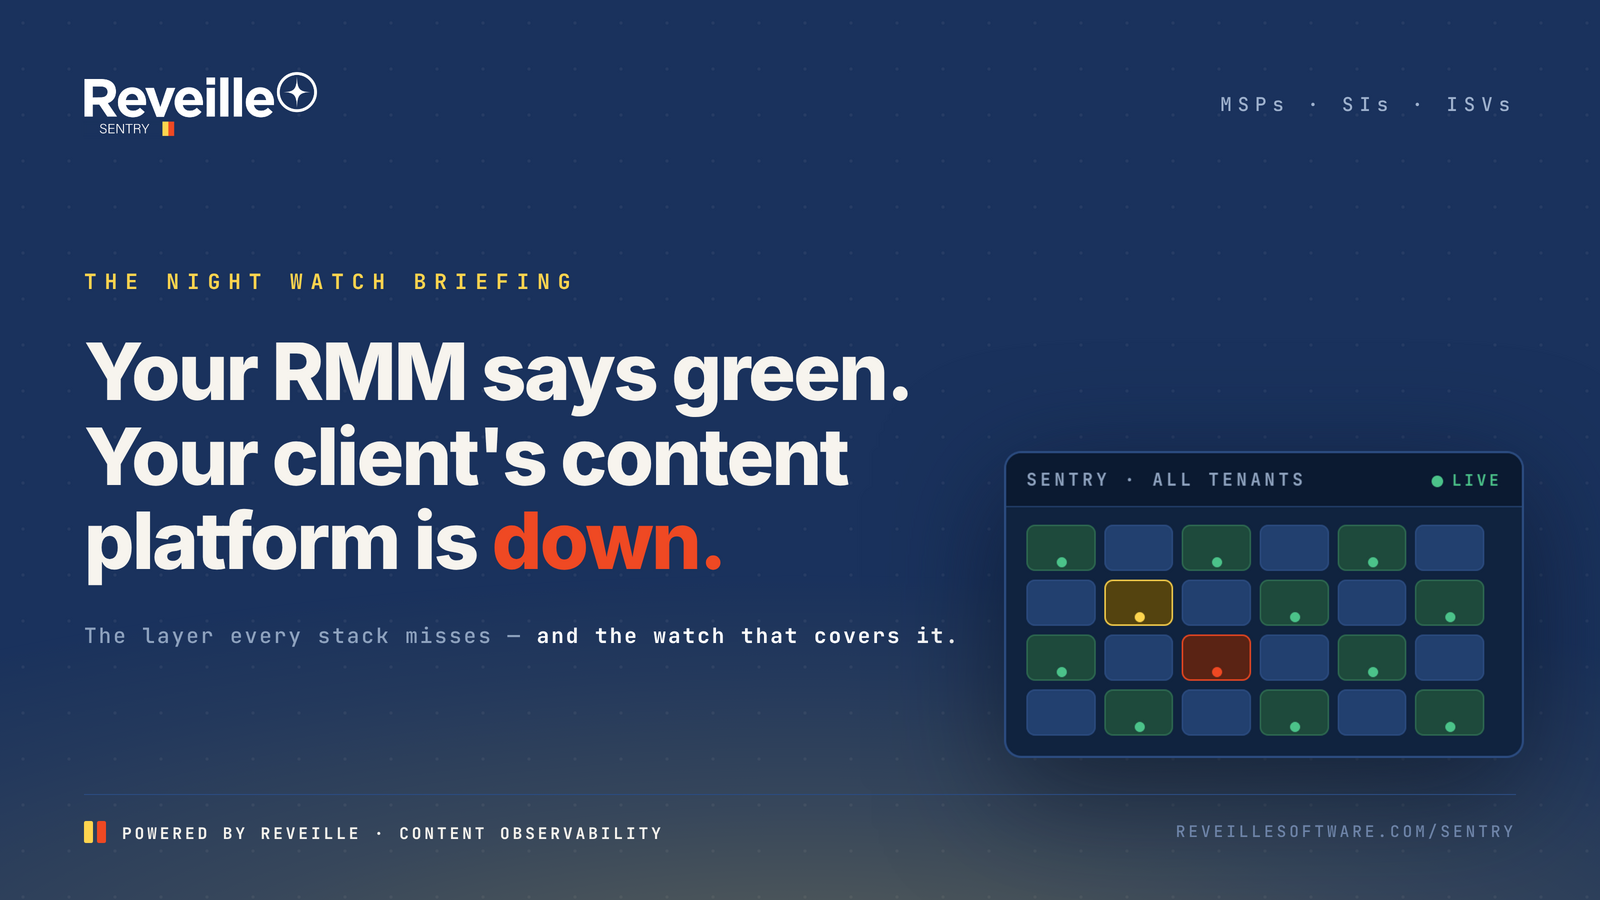
The call comes in at 8:04 on a Monday. The client’s invoices haven’t posted since Friday night — four thousand documents deep in a stalled capture queue. You check your stack: RMM green all weekend. Endpoints green. Network green. Backups green. Every monitor you own did its job. None of them was watching the platform your client actually runs their business on.
Every tool in your stack is telling the truth. None of them is watching the thing the client pays you to run.
The short version, up front.
The stack watches everything except the thing clients call about.
Walk the stack you’ve built. RMM on every host. PSA routing every ticket. Endpoint protection, network monitoring, patching, backup verification. It’s a serious operation, and it works — at the layer it was built for.
Now walk the layer your contracts are actually written against. The claims system that has to process first notices by 9 AM. The loan files that have to be retrievable at closing. The invoices that post overnight through a capture-and-extraction pipeline. Those live in Enterprise Content Management (ECM), Intelligent Document Processing (IDP), and RPA platforms — OnBase, FileNet, Documentum, ABBYY, UiPath — and their failure modes never touch a host metric:
- A capture queue stalls at 11 PM Friday. The service is “running.” The documents just stop moving.
- A workflow timer never fires. Timers aren’t a Windows service — there’s nothing for the RMM to page on. Approvals silently stop routing.
- An index service falls behind. The process is alive, the backlog is six days deep, and search can’t find anything scanned this week.
- The IDP-to-ECM handoff drops. Both hosts green. The extracted data never lands in the record.
| Layer | What the RMM reports | What the client feels |
|---|---|---|
| Capture queue | ● Host healthy · service up | 4,000 documents stuck since Friday night |
| Workflow timers | ● No signal — timers aren’t a service | Approvals that never routed |
| Index service | ● Process running | Search can’t find this week’s documents |
| IDP → ECM handoff | ● Both hosts green | Extracted data missing from the record |
| User experience | ● No view at all | 40-second retrievals — and staff stop trusting the system |
THE UNWATCHED LAYER · WHAT GREEN DASHBOARDS MISS
More tools, more alerts — less seen.
The instinct, when something slips through, is to add another tool. The channel’s own numbers say that instinct is the problem. A Heimdal survey of 80 MSPs, reported by ChannelE2E, found more than three-quarters of MSPs face alert fatigue monthly — over half weekly or daily — and that the MSPs drowning in daily fatigue run an average of 7.4 tools, against 4.5 for those with fewer issues. One in four alerts is a false positive; in some shops it’s more than 30%.
The cost side is just as blunt. One channel analysis of tool sprawl estimates the drag at roughly a fifth of margin once license stacking, integration overhead, and context switching are added up — against an industry average net margin it pegs at just 8%. Directional math, but the direction is unambiguous.
Here’s what makes the content-platform blind spot different: it isn’t a missing eighth infrastructure tool. Those 7.4 tools all watch the same layer, and they’re generating noise about it. The layer that generates the 8:04 call — the platform layer — has zero coverage. More of the same stack doesn’t close the gap. It just raises the noise floor over it.
You’re standing the Half-Watch.
The Half-Watch, defined.
The Half-Watch: standing a faithful, well-instrumented watch over infrastructure while the platforms clients actually feel — ECM, IDP, RPA — run unwatched. The watched half almost never produces a client call. The unwatched half produces nearly all of them.
Your SLAs aren’t written against CPU. They’re written against outcomes that live on the content layer: claims processed, loans booked, records retrievable, invoices posted. Clients don’t experience your infrastructure — they experience their processes. So when a client-visible failure happens, it happens, almost by definition, in the half of the estate your stack can’t see.
That’s why the Monday call stings twice. Once because the queue stalled — and once because the client found it before you did. The Half-Watch doesn’t just miss incidents; it hands your client the job of detecting them.
The unwatched half is a P&L problem.
Every miss on the content layer bills against you four ways. Reactive hours — senior engineers pulled into unbillable firefighting at the worst possible time. SLA exposure — credits and penalty conversations for outages your stack never saw. Renewal risk — the client who found Friday’s failure on Monday remembers it in the renewal meeting. And the quiet one: undifferentiated service — if your watch ends where every competitor’s watch ends, the deal comes down to price.
Flip it, and the same layer is the margin story. The provider who can stand an SLA-backed watch on the platforms themselves — and show a tenant-level record of it — is selling something the next proposal can’t match. The blind spot is the opening.
What the full watch looks like.
This is the problem Reveille SENTRY — a partner and software program powered by Reveille — was built for: putting the content layer itself under watch. Platform-level and user-level checks across ECM, IDP, and RPA. Every client, every tenant, on one pane of glass. Proactive alerts and automated self-healing that catch and correct issues before the client is impacted — and an auditable, tenant-level record that turns your SLA from a promise into evidence.
Two Mondays. Same stack underneath.
The 8:04 call. Four thousand documents stalled since Friday. Two engineers off billable work until noon. A credit memo, an apology, and a client who now checks the system before trusting you with it.
One line in the overnight log: 02:17 — queue stall detected, remediation run, throughput verified. Zero tickets. The Monday report to the client shows an incident they never felt — caught, healed, and documented under your brand.
The blind spot, answered.
What is Reveille SENTRY?
Why do clients report outages my monitoring never caught?
Can MSPs watch OnBase, FileNet, ABBYY, and other platforms without a separate console per client?
Does closing the blind spot mean adding headcount?
Stand the full watch.
The watch never blinks. One pane. Every client. Platform-level detection, automated self-healing, and the tenant-level record that backs the SLA you sell — with your brand up front and our watch behind it.